Project Details
Phenology is the study of cyclic and seasonal natural phenomena, especially in relation to climate and plant and animal life. Phenology affects nearly all aspects of the environment, including the abundance and diversity of organisms, their interactions with one another, their functions in food webs, and their seasonal behavior, and global-scale cycles of water, carbon, and other chemical elements.
For this assignment you will make careful observations of a tree on campus throughout the school year. These observations will allow you to identify the seasonal changes that occur for the tree. You will compile the data into a website that will be shared with the school community. Over the course of the next couple of years we will see how the trees on campus change as more students are involved in this project.
You will make observations each month (Sept, Oct, Nov, Dec, Jan, Feb, Mar, April, May). You should make a folder in your google drive where you keep a record of your observations as well as all images. Make sure you name your images with a description and the date so you can put them in order later. Each month you will update your website with the photos and graphed data. You will not need to describe the trends in the data or write your summary paragraph until all the data has been collected.
Tree location
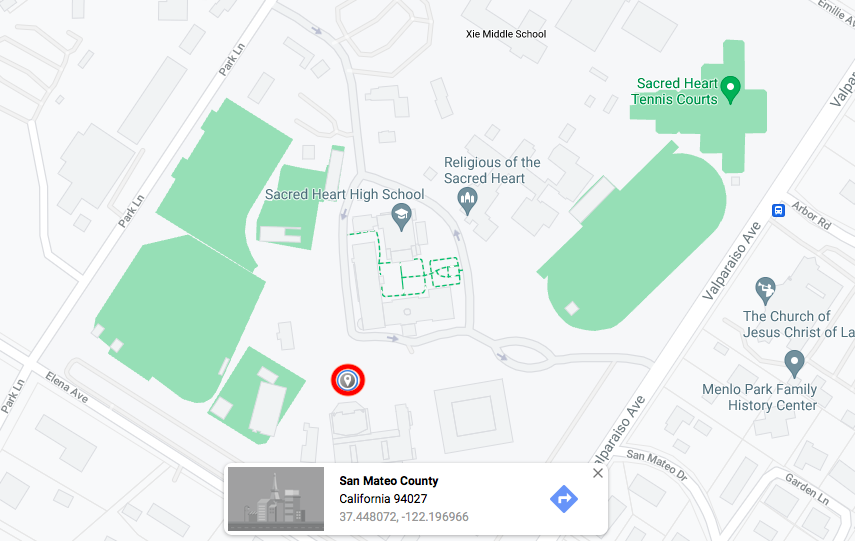
First you will need to pick a tree. Use your GPS on your phone to identify the exact coordinates of your tree. Take a screen shot of the map so we can see where your tree is located. This information will not change so once you record this information once you are done.
For example, the circled location on the map could be the location of your tree. The GPS coordinates are 37.448072, -122.196966. The screen shot of the map lets the reader know where on campus they can find your tree.
For example, the circled location on the map could be the location of your tree. The GPS coordinates are 37.448072, -122.196966. The screen shot of the map lets the reader know where on campus they can find your tree.
Data Collection
- A picture of your tree (note the angle and distance, all pictures should be from the same angle and distance). This picture should show your whole tree. The idea is that we will be able to compare your tree from month to month.
- Date – use a day-month-year format. (4 September, 2015 ), and Time of observation - use a 24 hour clock format (1:00pm would be written as 13:00, 2:00pm would be 14:00). Ideally you will make your observations at the same time of day each month. However, it is understood that you might not be able to time your observations perfectly each month and that sometimes there might be more days between observations and sometimes the observations will be slightly closer together.
- Temperature - use a weather app if you don’t have a thermometer. This is one of the data points that you will graph.
- Wind speed - use a weather app. This is one of the data points that you will graph.
- Description of the weather. You should include information about the cloud cover, humidity (does the air feel dry or wet), precipitation, etc.
- Tree size - multiple measurements - minimum of 2.
Height from ground to the highest leaf/branch
Width of the crown (from one side to the other)
Circumference of the trunk (must be measured at the same height off the ground each time) - Description of the tree’s bark - include a picture
Tree Bark - Write a description of the bark. Think about the smell, color, texture, etc.
Take a close up picture of the tree bark. Include a ruler or standard object for scale. - Leaf color, size, and number - include a picture
Leaf Color - describe the color of the leaves. Are all leaves the same color? Is the top of the leaf and the bottom of the leaf the same color? Is the color uniform throughout the leaf?
Leaf Size - measure the smallest leaf you can reach and the largest leaf you can reach. If you do not have a ruler you can compare the size to a standard object such as a quarter, a soda can, etc.
Take a close up photo of an average leaf from your tree. If possible, include a ruler next to the leaf or a standard object for scale.
Leaf Count - Estimate the total number of leaves by choosing a branch in the middle of the crown. Count all the leaves on that branch. Now count the total number of branches. Multiply the number of leaves on a single branch by the number of branches to get the estimated total number of leaves. Show your work.
Leaf Arrangement - are the leaved opposite each other or are they alternating on the branch.
Leaf Drop - Are there any leaves from your tree that have fallen on the ground? If yes, describe their age (newly fallen, old), their size compared to the leaves on the tree, the color, the smell. - Description of fruit/flowers/seeds/cones/roots - include a picture. Describe any non-leaf/branch structures. Think about their size, color, smell, and quantity. (Please do not taste anything from your tree)
- Description of the area around the tree. Look around your tree, has any part of your tree fallen on the ground? Does the tree look uniform and healthy or are there parts that might be sick/dying? Has your tree been damaged? Are their broken branches on the tree or on the ground? Is there evidence of human interference with the tree?
- Description of animals observed or evidence of animals. Describe any animals you see. How are they interacting with the tree (perching, nesting, eating)? Where are they on the tree? Describe any evidence of animals that you observe (scratches on bark, chewed leaves, feces, hearing bird songs). What type of animal do you think left this evidence?
- Description of what you hear while sitting near your tree. Spend 3-5 minutes sitting next to your tree with your eyes closed, listening. Closing your eyes helps you focus on the sounds. Make sure you are in a safe place, where you will not be bothered or in danger while sitting with your eyes closed.
Presenting your data
You will make a website to present your data. You will also make a QR code that we will put near the tree and that links to your website so that other people can check the progress of your tree.
Your website should be broken into sections with the first section being the location of the tree.
The next portion of your website should be for the photos of your tree. You will then arrange the photos of the tree in order and next to each other in a row so we can see how the tree has changed over time. Alternatively, you could put the images into a time lapse video if you want instead of posting each image. You should have 3 sets of images (the whole tree, the bark, and the leaves). It is possible you also have images of fruit/flowers.
Next, you will graph the data for the temperature, wind speed, number of leaves, and at least 1 of the tree size measurements. After each observation you should update your graphs. At the end of the project you will will write a short description of the trends for each graph and identify any inconsistencies with the data collection.
At the end of the project you will choose two other sets of observations to present. You will make a chart of the data for two for these observations (bark, fruit, flowers, insect activity, etc.)
Finally, you will write a summary paragraph describing how your tree changed, or did not change, over time. You should think about what you noticed changing, what data you wish you had collected, what you learned from observing your tree, etc.