Global Climate Change |
Assignment Details |
|
When we think about how humans are impacting the environment we often think of global climate change, resulting from increasing atmospheric carbon dioxide levels. We know that over the course of the year the atmospheric carbon dioxide goes up and down. In the fall and winter there is little photosynthesis occurring and there is a lot of decomposition because the leaves have fallen off the trees. Decomposers perform cellular respiration, resulting in increased CO2 levels in the winter. In the spring, plants start to grow, performing photosynthesis. Photosynthesis takes carbon dioxide out of the air and stores the carbon in the plants body. This means that from May to October the atmospheric CO2 levels are decreasing. This pattern of increasing CO2 in the winter and decreasing CO2 in the summer has been observed for many years.
However, while atmospheric CO2 changes over the seasons what we have seen is that on the whole, CO2 levels in the atmosphere are on the rise. When we compare the CO2 levels in one month to the same month the following year, we can see an overall increase in global atmospheric CO2. Scientists have concluded that human activities are the cause of this global increase in atmospheric CO2. Activities like deforestation, bring fossil fuels, driving cars, building cities and towns, heating our homes, all impact atmospheric CO2. While we can reduce our impact by planting trees, limiting use of fossil fuels, and increasing our use of renewable resources, there are other impacts to consider. Renewable resources also can impact the environment. In our study of the Mekong river we will be looking at the impacts of of increasing hydroelectric power along the Mekong Valley. The people in the area need electricity in order to access clean water and the technological resources we have available. Use the websites linked below to learn more about the pros and cons of damming the Mekong river. |
You are tasked with creating an infographic explaining your position on damming the Mekong river. You will make an infographic presents both sides of the debate on:
SHOULD WE DAM THE MEKONG RIVER TO PROVIDE ENERGY TO THE SURROUNDING AREAS? For this assignment you can chose to work individually or in pairs. You can choose your own partner. Piktochart is an online program that will help you make your infographic. However, you should have a sketch of what you want your infographic to look like before using the program. Requirements for your infographic:
Suggestions:
|
Resources:
Mekong Flows is a website that "is dedicated to providing information on potential flow changes in the Mekong River and its tributaries. Outcomes of on-going research on the expected environmental and economic impact of these changes are also presented.” They published the following report:
The Mekong region is rapidly developing and energy to support economic growth is in high demand. Current instability of oil and gas prices, concerns about the future of fossil fuel energy, and the availability of private financing are making hydropower more attractive and accelerating its development in the Mekong River Basin (MRB).
The potential of hydropower in the MRB is about 53,000 MW consisting of 23,000 MW in the Upper Mekong Basin (China) and 30,000 MW in Lower Mekong Basin (Lao PDR, Thailand, Cambodia and Viet Nam). Locations current and proposed hydropower projects are shown in the map. locations and current stage of the projects (26 projects are locate in the mainstream and the remaining 126 projects are in the tributaries).
There are 4 operating hydropower facilities in the mainstream of Mekong River in Yunnan Province of China with install capacity of 8,850 MW. Another3 projects are under construction. Two of these, -Xiaowan and Nuozhadu, have large storage reservoirs (> 27 km3) which could cause significant changes in flow regimes, water quality and sediment transport.
The tributaries in the LMB are currently producing 3,225 MW (10% of its potential) and a further 3,209 MW are under construction. Thailand and Viet Nam have developed most of their potential tributaries sites. Lao PDR has the largest remaining potential for hydropower and is currently striving to accelerate development.
The mainstream of the LMB has a potential to produce over 13,000 MW of hydropower. Over the past few years, investors and developers mostly from China, Malaysia, Thailand and Viet Nam have submitted proposals for twelve hydropower projects for the LMB mainstream. Those proposals are among the largest and most significant developments ever considered by LMB countries in terms of benefits and risks.
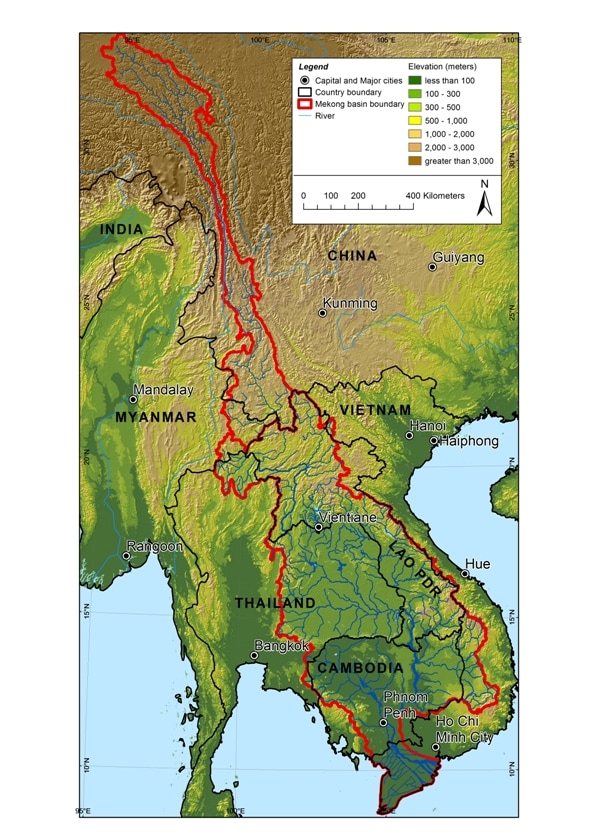
Map design: University of Canterbury, Data source: MRC Hydropower database
References:
MRC (2010), State of the Basin Report 2010
MRC (2010), Summary of the final report, Strategic environment assessment of hydropower on the Mekong mainstream.
References:
MRC (2010), State of the Basin Report 2010
MRC (2010), Summary of the final report, Strategic environment assessment of hydropower on the Mekong mainstream.
Example Infographics

Loading...
Other things to research:
- Biodiversity of different rivers in Asia/the world
- Number of people living off the river in different countries
- Amount of electricity used by different countries (per person)
- Wealth of the different countries (GDP)
- Numbers of people displaced by current dams
- Effect on biodiversity of current dams (number of species lost)
Grading: 30 points total
|
Reasoning: 10 points
|
5 reasons in favor of damming the river. 5 reasons against damming the river. At least four of the reasons must have numbers (statistics, values, energy produced, # of species lost, etc.)
|
|
Graphics: 5 points
|
1 graphic or symbol for each reason. Use the shapes and icons button.
|
|
Graphs: 6 points
|
Two graphs (1 pro, 1 con). The graphs must be made by you, using the program. Find the graph maker in the tools section. Your graph can be a line graph, bar chart, pie graph, or a map. Maps have to have data for the countries typed into them. Minimum of 3 data points per graph.
|
|
Conclusion: 2 points
|
Couple sentence summary of what you think should be done.
|
|
Sources: 5 points
|
Bibliography in MLA format. All data must be sited with parenthetical citations. This means that you will put a parenthesis [2] next to the information with a number in the parenthesis that indicates the source that you used to find the information. Don't forget to cite the graphed information as well as the reasoning.
|
|
Presentation: 2 points
|
The infographic should be well formatted so that it is easy to understand. Text sizes should make sense. Icons should be arranged to line up. It should look nice.
|