Data tables are tools that can be used to make data collection easier as well as tools to show trends or allow the reader to compare data. If not designed correctly data tables can be difficult to read and will not convey the information you mean to show.
How to design a data table for an experiment:
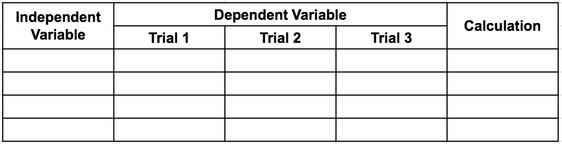
If your experiment has a dependent and independent variable:
- Put the independent variable (that which you purposefully change) in the left column
- The dependent variable (that which you measure) in the next column. Make this column wide enough that you can divide it into your trials.
- If you will have calculations, such as the difference, or the mean, add another column farthest to the right.
Experiments with multiple conditions: If your experiment is to show a comparison between conditions (such as a starting starting temperature and ending temperature, or in area 1 compared to area 2), then you can either have two tables, or, you can combine them.
Consider the following experiment:
You want to see how eating breakfast affects student performance on a math test.
Consider the following experiment:
You want to see how eating breakfast affects student performance on a math test.
- Independent variable: the student
- Dependent variable: score on the math test
- Conditions = breakfast vs. no breakfast
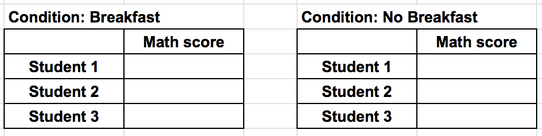
The tables above are great for data collection but they don't easily allow you to compare the conditions. In order to easily compare the conditions you can combine the two tables into one. To do this, follow the rules below:
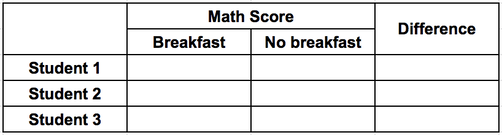
Using these new rules, the comparison is between breakfast vs. no breakfast is easier to see. We can also now include a calculations column, making it even easier to compare the data.
- Put the independent variable (that which you purposefully change) in the left column
- The dependent variable (that which you measure) in the next column. Make this column wide enough that you can divide it by conditions.
- If you will have calculations, such as the difference, or the mean, add another column farthest to the right.
Using these new rules, the comparison is between breakfast vs. no breakfast is easier to see. We can also now include a calculations column, making it even easier to compare the data.
How to design a data table to see a trend/pattern:
It is easier to identify patterns in numbers when looking down the column rather than across a row. Therefore you should decide what data to put in columns and which to put in rows based on what you want the reader to observe and what patterns you are hoping to identify.
|
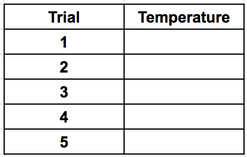
For example, lets say you want to find out the melting temperature of iron. To figure this out you will need to do a bunch of trials, melting the iron over and over and taking the temperature each time. The two things you will need to record is the trial and the temperature.
In this example you want to be able to see a trend or pattern in the temperatures. So, you will need a temperature column. If temperature is the column then the rows will be the different trials. In the end, your table will look like this: |
|
Formatting: Titles, Headings, Numbers and Units
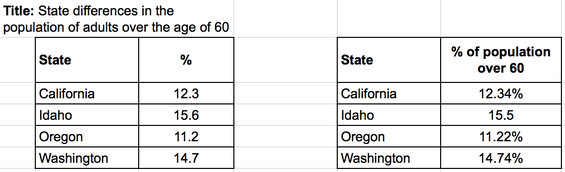
All tables should be presented with a title. The title should have enough detail that a reader can understand the content of the data without having to read accompanying text.
Headings should be clear and concise. Units should be presented in the column headings rather than repeated in each row.
Headings should be clear and concise. Units should be presented in the column headings rather than repeated in each row.
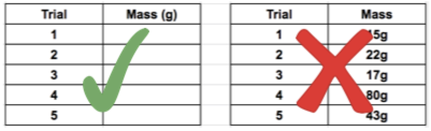
Numbers should be presented in the most simple format and with as much similarity as possible. For example, you should write 4.6 million rather than 4,600,000. This might mean that you need to round numbers, particularly when making calculations. For example, the average of 4.6, 5.2, and 6.3 is 5.3666666667. As the actual data is measured to one decimal place the average should also be presented to one decimal place, 5.4 instead of 5.3666666667.
See the two examples below:
|
Good:
|
Bad:
|