African Elephants
|
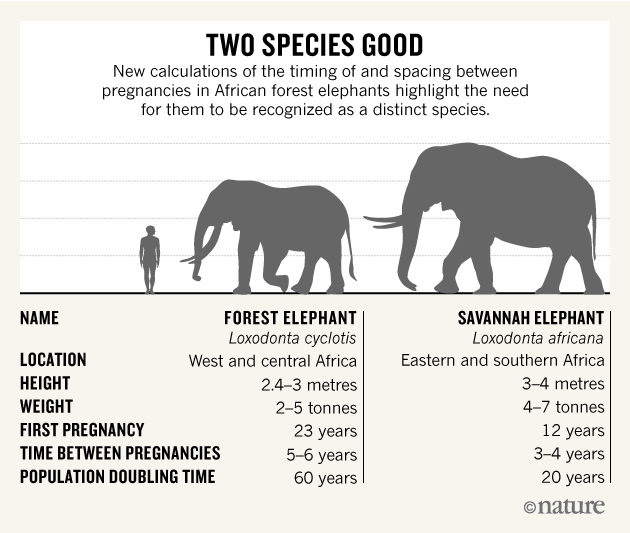
African elephants are the world's largest land animals. The biggest can be up to 7.5m long, 3.3m high at the shoulder, and 6 tonnes in weight. The trunk is an extension of the upper lip and nose and is used for communication and handling objects, including food.
Tusks, which are large modified incisors that grow throughout an elephant's lifetime, occur in both males and females and are used in fights and for marking, feeding, and digging. The other notable feature of African elephants is their very large ears, which allow them to radiate excess heat. There are two subspecies – the larger savannah elephant (Loxodonta africana africana), which roams grassy plains and woodlands, and the smaller forest elephant (Loxodonta africana cyclotis), which lives in the equatorial forests of central and western Africa. Savannah elephants are larger than forest elephants, and their tusks curve outwards. In addition to being smaller, forest elephants are darker and their tusks are straighter and downward pointing. The complex social structure of elephants is organized around a system of herds composed of related females and their calves. Males usually live alone but sometimes form small groups with other males. In the savannah subspecies, each family unit usually contains about 10 individuals, although several family units may join together to form a 'clan' consisting of up to 70 members led by a female. Forest elephants live in smaller family units. African elephants once roamed across most of the continent from the northern Mediterranean coast to the southern tip. But they are now confined to a much smaller range. Savannah elephants occur in eastern and southern Africa, with the highest densities found in Botswana, Tanzania, Zimbabwe, Kenya, Zambia and South Africa. The forest elephant is found in the equatorial rainforest zone of west and central Africa, where relatively large blocks of dense forest still remain. Since 1979, African elephants have lost over 50% of their range and this, along with massive poaching for ivory and trophies over the decades, has seen the population drop significantly. Back in the early part of the 20th century, there may have been as many as 3-5 million African elephants. But there are now around 415,000. Significant elephant populations are now confined to well-protected areas. However, less than 20% of African elephant habitat is under formal protection. ThreatsDespite a ban on the international trade in ivory, African elephants are still being poached in large numbers. Their ivory tusks are the most sought after, but their meat and skin are also traded. Tens of thousands of elephants are killed every year for their tusks. The ivory is often carved into ornaments and jewellery – China is the biggest consumer market for such products. The ban in international trade was introduced in 1989 by CITES (Convention on International Trade in Endangered Species of Wild Fauna and Flora) and it allowed some populations to recover, especially where elephants were adequately protected. But there has been an upsurge in poaching in recent years, which has led to steep declines in forest elephant numbers and some savannah elephant populations. Thriving but unmonitored domestic ivory markets continue in a number of states, some of which have few elephants of their own remaining. Insufficient anti-poaching capacity, weak law enforcement and corruption compound the problem in some countries. Meanwhile, as the human population expands, more land is being converted to agriculture. So elephant habitat is shrinking and becoming more fragmented. This means elephants and people come into contact more often, and conflicts occur. Elephants sometimes raid farmers’ fields and damage their crops – affecting the farmers’ livelihoods – and may even kill people. Elephants are sometimes killed in retaliation. With human populations continuing to grow across their range, habitat loss and degradation will remain major threats to elephants' survival. While some populations of African elephant are secure and expanding, primarily in southern Africa, numbers are continuing to fall in other areas, particularly in central Africa and parts of East Africa. With an estimated 415,000 elephants left on the continent, the species is regarded as vulnerable, although certain populations are being poached towards extinction. It is critical to conserve African elephants since they play such a vital role in their ecosystems as well as contributing towards tourism and community incomes in many areas. By helping protect elephants, we’re helping conserve their habitat, supporting local communities, and making sure natural resources are available for generations to come. Adapted from: http://wwf.panda.org/knowledge_hub/endangered_species/elephants/african_elephants/
|
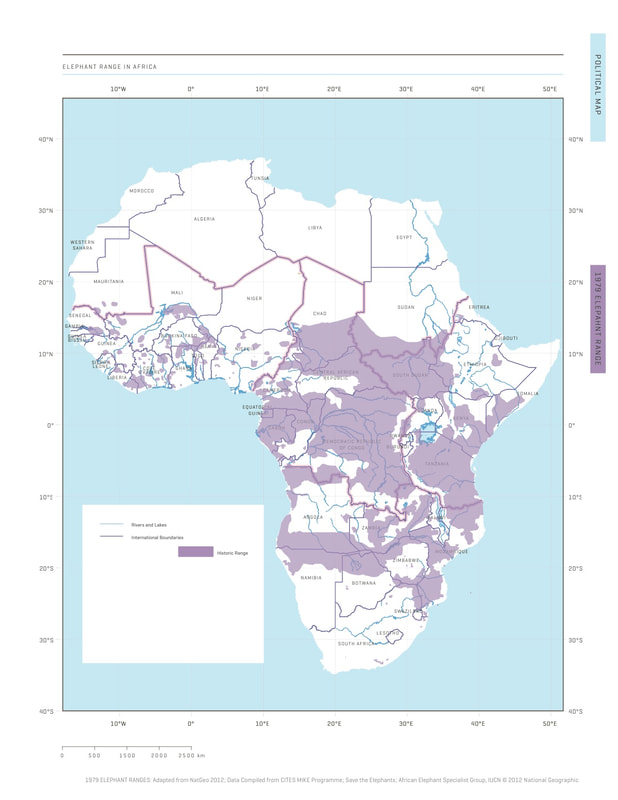
The map above shows the distribution of African elephants in 1979.
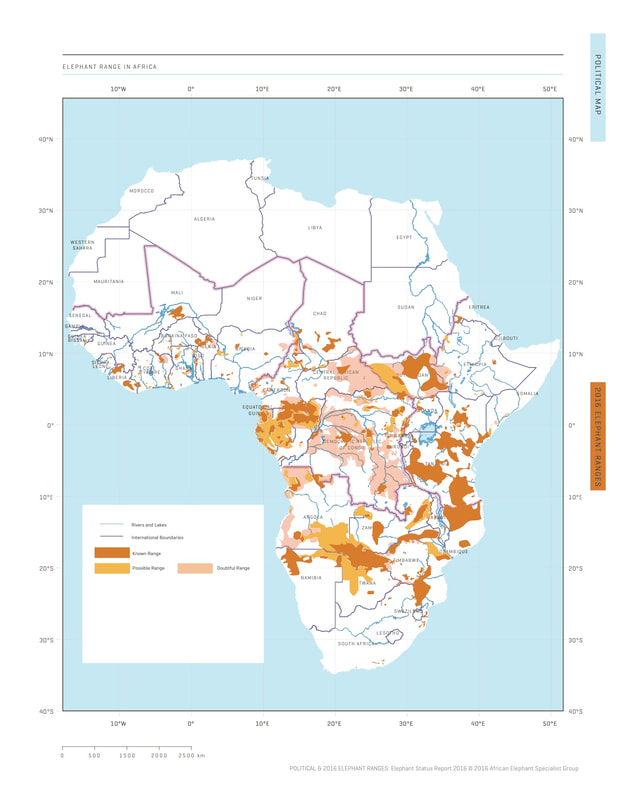
The map above shows the distribution of African elephants in 2016.
|
Scientific Research Articles |
Links for research:
|
|
In the HHMI “Click and Learn” you learned that investigators can use DNA to identify where a piece of ivory originated. By collecting elephant dung samples, researchers like Sam Wasser at University of Washington have created genetic profiles for the many different elephant populations found throughout central Africa. Once the dung samples have been analyzed in the lab, different single tandem repeats (STRs) in the genome are identified as helpful in distinguishing populations. The unique allele frequencies of a population across many STRs act as a genetic ID tag which is then stored in a database. By accessing this database and analyzing the DNA of seized ivory, authorities can pinpoint which population of elephants it came from, giving insight into the location of the poachers and trends in their behavior.
|
The Lab
In this investigation, you will be analyzing a cache of ivory seized in-transport through Hong Kong. Using gel electrophoresis, you will be able to identify the genetic information contained within a piece of ivory and identify the population it came from. Knowing the source population will allow you to determine if the cache represents a collection of ivory poached from many different areas, or if the cache represents a “hot spot” (in which most the ivory originates from a single population).
Part 1: Prepare the Gel
- Find another lab group that is ready to pour a gel.
- Pour a gel using preheated agarose. Make sure to put the comb in on the correct side. (DNA is negatively charged so the comb should be placed at the top of the gel, closest to the negative side.)
- Measure 30ml of agarose into the medicine cup (it will be almost full)
- Add 3μl of SYBR to the medicine cup with the liquid agarose. Stir until evenly mixed.
- Pour the agarose from the medicine cup into the casting tray (make sure the comb is at the top of the tray and that the 6 comb side is down). Fill both sides of the tray by pouring half of the agarose into each side.
- Remember: SYBR is light sensitive so after pouring the gel you need to cover the casting tray with aluminum foil.
Part 2: Prepare the Ivory Samples
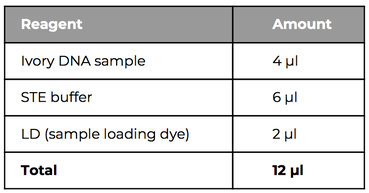
- Obtain 5 ivory samples and the DNA ladder from your instructor. Each tube contains 4 μl of DNA amplified from one ivory piece in the cache. Spin the samples in the microcentrofuge for 3-5 seconds. Record which sample numbers you have in the table at your lab station.
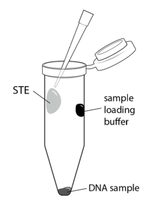
- Prepare your samples for gel electrophoresis by adding STE buffer and sample loading dye.
- Add 6 μl STE buffer to the inside wall of each tube of DNA without touching the sample at the bottom of the tube. This way you can use the same tip for all the tubes.
- Using a new tip add 2 μl LD (sample loading dye) to another area on the inside wall of each tube.
- Close the microtubes and place them in a microcentrifuge. Spin for 3-5 seconds to pull all the liquid to the bottom of the microtubes.
|
The tube already contains a sample of DNA. You are adding the STE buffer and the Sample Loading Dye to the DNA that is already in tube.
|
Part 3: Load and Run the DNA samples
Prepare the gel box:
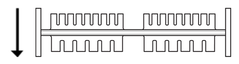
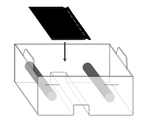
- Place the black gel plate into the buffer chamber. If it doesn’t fit turn it around and match the ridges. (See image to the right)
- Remove the comb by gently pulling the comb upwards. If you remove the comb too quickly you may break or collapse the wells.
- Remove the gel tray holding the gel from the casting system. Place it carefully into the gel box with the wells closest to the negative end.
- Measure 140 ml of 0.5X TAE into the beaker and pour it into one side of the tank until both sides of the tank are full. (Pouring the buffer into one side of the chamber helps to release any air bubbles trapped under the gel.) Add more buffer if the gel is not totally covered. - TAE buffer can be found on even numbered lab stations.
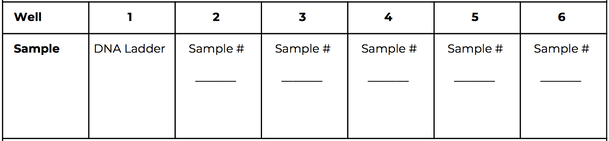
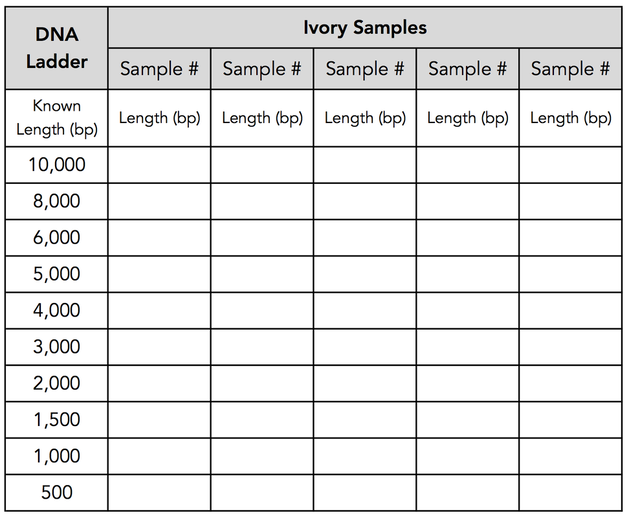
- Label your sample numbers in the table below provided. This will help you organize which samples you will load into each well.
Load and run the DNA:
- Place the gel box near the power source you will use. Once you have loaded your gel, you should not agitate or move the box.
- Load 8 μl of DNA ladder into the first well on the left.
- Load 10 μl of each sample according to your table.
- Place the orange cover on the box.
- Press power and record your start time. A small green power light should turn on if it is running. Wait 5 minutes.
- After the 5 minutes, turn on the high intensity blue light and check if your samples have moved.
- Check your gel at 25 minutes. Continue to run your gel until the lowest DNA band is at the 3 cm mark.
- Turn off the power and take a picture of your results.
- Record your results by taking a photo of the DNA. Use the stylus on your Chromebook to label your results with the sample numbers for each lane. Then upload your picture to Canvas.
Part 4: DNA Analysis
- Using your picture estimate the size of the bands (in bp).
- Record the length of each band in the table below.
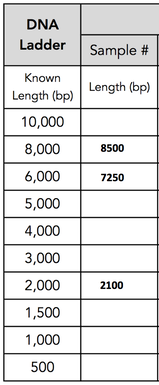
- See in the example diagram that there are three bands in the example sample (lengths: 8500, 7250, and 2100)
|
Example Data
|
Part 5: Discussion
There are two possible findings of interest:
(a) the ivory cache originates primarily from one population of elephants or
(b) the ivory comes from a mix of many different populations. Each finding is suggestive of who is poaching (large organized group or individuals) and will result in different solutions.
If the cache primarily comes from one population there may be a supply “pipe-line” for this area or park, suggesting that the poaching may be supported by a cartel or larger organization. Through this finding, conservation and preservation efforts can be focused in a particular area, country, or transit point.
If the cache primarily originated from multiple disperse populations, the ivory may be the result of poaching by smaller groups or individuals. In this case, conservation solutions may be very different and more community focused.
- Use the elephant databases to identify which population your ivory samples came from. The largest band in your DNA sample represents a genetic marker for forest or savanna (10300 bp = savanna; 6000 bp = forest). This will help you determine which data set you need to search through.
- Once your lab group has identified the origins of your ivory samples you need to add them to the class data. This will allow us to see if there are any trends or “hot spots”. Add your data to the google sheet. You are only entering data in the last column on the first page. If the location you want to add data for already has a number in the column then add your number of samples to the starting number and put the total in the cell.
- Once all the data is in the google sheet it will use the coordinates from the databases to update each sample's location on the map of Africa to create a visual representation of the data.